 The 2026 Thesis
OfficeRnD's Thesis: Flexible space has crossed the threshold from alternative experiment to core corporate real estate infrastructure. The phase of "grow at all costs" is over. The operators who will dominate 2026 and beyond are those building operationally mature, yield-optimized businesses — not those opening the most locations or selling the most cheap desks.
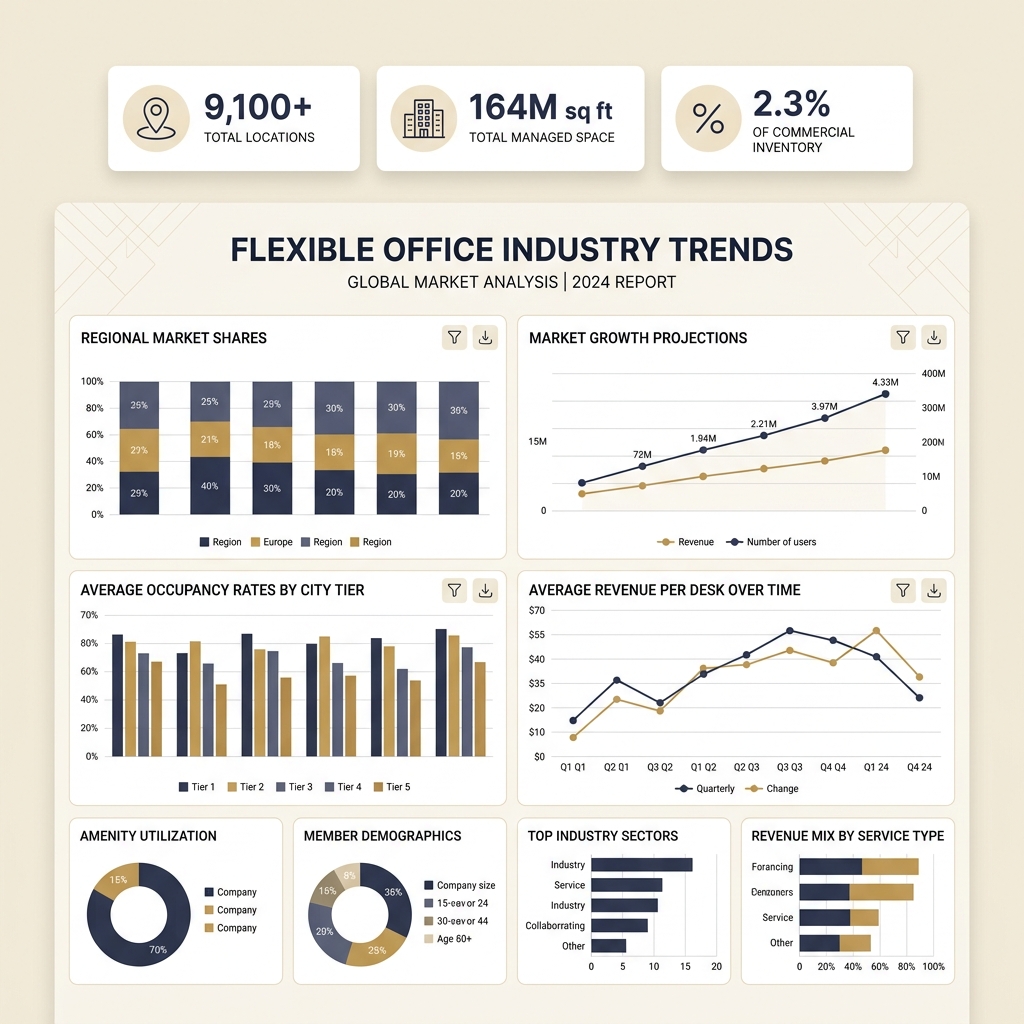
2026 Market Snapshot
The gap between current market penetration and historical commercial lease norms — where flex is projected to reach 10% to 30% of total office inventory in mature markets — is the defining opportunity for operators and landlords positioned to capture enterprise demand over the next decade.
The Five Structural Trends Defining 2026
Flex as Core Corporate Infrastructure
Flexible workspace has permanently crossed from "nice-to-have" to essential. Enterprise companies are embedding flex space into their core real estate portfolios as a deliberate strategy for workforce agility, hybrid work support, and capital efficiency. Operators who can demonstrate enterprise-grade product quality and service level agreements are capturing this demand at premium pricing.
Shift to Managed, Turnkey, and Partnership-Led Models
Landlords are actively moving away from traditional coworking leases toward revenue-sharing management agreements. The sector is witnessing a broad structural shift toward alignment-based operating partnerships — consistent with the management agreement trend identified in our 2025 outlook. This is not a niche development; it is becoming the standard commercial framework for new flex deployments.
The Elevated Member Experience Bar
Member expectations have risen permanently. Premium design, hospitality-grade service, and a tangible sense of community belonging are now table stakes, not differentiators. Operators who invested in experience are seeing stronger retention. Those who commoditized their offering to compete on price are experiencing accelerating churn and yield compression.
Revenue Efficiency Over Raw Occupancy
The most operationally sophisticated operators have adopted Revenue Per Occupied Desk (RevPOD) as their primary KPI — replacing raw occupancy percentage as the leading performance metric. AI-powered dynamic pricing, strategic product mix management, and disciplined yield management are the tools separating margin leaders from margin laggards.
Community Infrastructure and Niche Markets
Coworking is being recognized as essential community infrastructure in suburban and residential markets — not just a commercial real estate product. The growth of hyper-local spaces and niche, industry-specific environments continues to outpace generalist coworking. Secondary markets frequently show higher RevPOD growth rates than gateway cities due to lower competition and stronger local community identity.
Revenue Efficiency: The Metric That Matters
The shift from occupancy-focused to revenue-efficiency-focused operations is the defining characteristic of mature flex markets. OfficeRnD's data shows that many operators running at 85% occupancy are generating lower net revenue than competitors at 72% occupancy — because the higher-occupancy operators are selling primarily open desks at commodity prices while the lower-occupancy operators have built private suite inventory priced at enterprise yield levels.
What Revenue Efficiency Looks Like in Practice
A 10,000 SF coworking space selling 120 hot desks at $250/month generates $30,000 in monthly desk revenue at 100% occupancy. The same 10,000 SF reconfigured as 20 private offices at $3,500/month generates $70,000 at 100% occupancy — with lower management complexity, higher member stability, and significantly stronger NOI for the building owner.
What This Means for Operators and Landlords
OfficeRnD's 2026 outlook carries clear strategic implications for anyone operating or considering operating in the flexible workspace market:
- Invest in private suite inventory: The revenue gap between hot desk and private suite pricing is too large to ignore. Any capital deployment should prioritize enclosed, dedicated workspaces over open-plan seating expansion.
- Adopt management agreement structures: Landlords should proactively model revenue-sharing management agreements instead of waiting for leases to expire. Operators should present this structure as the preferred partnership framework — it is increasingly accepted as the market standard.
- Build technology infrastructure for yield management: Operators without dynamic pricing capability and real-time occupancy analytics are flying blind. The margin leaders in 2026 are using data to optimize product mix and pricing on a continuous basis.
- Position for secondary markets: Gateway city competition is intensifying. Secondary and tertiary markets — particularly suburban residential corridors — offer higher relative RevPOD opportunities, lower capital costs, and stronger local community anchoring.
- Elevate the experience bar: Budget experience is a liability in 2026. The cost of retrofitting a space to meet raised member expectations is nearly always higher than building to that standard from launch.
Frequently Asked Questions
What is OfficeRnD and why does their data matter?
OfficeRnD is a leading flexible workspace management software platform used by thousands of coworking operators globally. Their industry outlook is grounded in aggregated operational data from real locations — occupancy rates, revenue per desk, membership trends, and product mix performance — making it one of the most data-backed perspectives available in the sector.
Is the 2.3% market penetration figure significant?
Extremely. Commercial real estate research consistently projects flexible workspace growing to 10% to 30% of total office inventory in mature markets over the next 10 to 15 years. Being at 2.3% today means the sector has captured only a fraction of its long-term potential — even as enterprise adoption is accelerating and hybrid work patterns are structurally normalizing flexible space demand.
How should a landlord respond to the management agreement trend?
Proactively. The management agreement structure is no longer a niche negotiating position — it is becoming the standard framework for new flex deployments, particularly in multi-tenant office buildings above 100,000 SF. Landlords who model the revenue-sharing structure against traditional lease assumptions typically find the management agreement superior under any occupancy scenario above 55%.
Ready to Optimize Your Flex Strategy for 2026?
Whether you are an operator looking to improve revenue efficiency or a landlord evaluating a management agreement structure, we can help you model the right approach for your specific asset, market, and growth stage.
Request a Flex Strategy Session